Monitoring MicroServices and Prometheus
Prometheus has established itself as mainstay for application monitoring, alerting, and safe keeping of our key operational behaviours by maintaining a time series store of metrics from our application containers. As its lightweight, and focuses on high availability, Prometheus when deployed to a container platform can provide a cloud native means to monitoring application runtimes in our containers.
For distributed integration platforms like Red Hat Fuse, this need becomes even greater as our MicroService based architectures may imply many pods choreograph according to the dictates of our integration which may span many integration endpoints across many pods. As a result, being able to asses health of our applications, operational behaviour, and longitudinal trending across our enterprise and act on those indicators becomes a mission critical factor in our MicroService orchestration in container platforms.
The Setup
It is worth noting, the following techniques as described in this article, do not require use of anything but Kubernetes (k8s), the CoreOS Prometheus Operator, and a Grafana instance.
For the purposes of this demonstration; however, we will use:
- Minishift With the latest CDK 3.11.0 installed (OKD 3.11.0)
- Red Hat Fuse Springboot Camel images (https://access.redhat.com/containers/?tab=images&platform=openshift#/registry.access.redhat.com/fuse7/fuse-java-openshift)
- Productized resource templates from Red Hat for preparation of our Prometheus Operator (https://github.com/jboss-fuse/application-templates)
- The Prometheus Operator as released by CoreOS (https://coreos.com/operators/prometheus/docs/latest/)
Minishift configuration
As our purposes are for demonstration only, we’ll use Minishift, and as our resources will be fairly lightweight, we’ll simply use a default profile for minishift and allow it to size itself accordingly. Please note, to extend this example out further, or to really get a better feel for what many microservices would look like in your container platform and monitored by Prometheus it is advised to establish more resources for the Minishift VM: https://docs.okd.io/latest/minishift/using/profiles.html
The Prometheus Operator
The Prometheus Operator leverages the Operator SDK “as a class of software that operates other software, putting operational knowledge collected by humans into software” (https://coreos.com/blog/introducing-operators.html). Through the use of the operator framework, the Prometheus Operator is able to install a Service Account (prometheus), install a replicated cluster of time series databases, and install itself to manage state of Prometheus over its lifecycle.
Prometheus CRD’s
Custom Resource Definitions (CRD’s) in Kubernetes are a means to extend out Kubernetes API resources to introduce into a project or cluster. The Prometheus Operator uses CRD’s as they are introduced as new resources into the cluster to perform operations such as adding service monitors for new types of applications, to configure rules to run against metrics collected from service monitors, or to configure alerts to send to the Prometheus Alert Manager.
For use of the prometheus operator, we’ll extend Kubernetes to install the following crd’s https://raw.githubusercontent.com/jboss-fuse/application-templates/master/fuse-prometheus-crd.yml:
apiVersion: apiextensions.k8s.io/v1beta1
kind: CustomResourceDefinition
metadata:
  name: prometheusrules.monitoring.coreos.com
spec:
  group: monitoring.coreos.com
  names:
    kind: PrometheusRule
    listKind: PrometheusRuleList
    plural: prometheusrules
    singular: prometheusrule
  scope: Namespaced
  version: v1
---
apiVersion: apiextensions.k8s.io/v1beta1
kind: CustomResourceDefinition
metadata:
  name: servicemonitors.monitoring.coreos.com
spec:
  group: monitoring.coreos.com
  names:
    kind: ServiceMonitor
    listKind: ServiceMonitorList
    plural: servicemonitors
    singular: servicemonitor
  scope: Namespaced
  version: v1
---
apiVersion: apiextensions.k8s.io/v1beta1
kind: CustomResourceDefinition
metadata:
  name: prometheuses.monitoring.coreos.com
spec:
  group: monitoring.coreos.com
  names:
    kind: Prometheus
    listKind: PrometheusList
    plural: prometheuses
    singular: prometheus
  scope: Namespaced
  version: v1
---
apiVersion: apiextensions.k8s.io/v1beta1
kind: CustomResourceDefinition
metadata:
  name: alertmanagers.monitoring.coreos.com
spec:
  group: monitoring.coreos.com
  names:
    kind: Alertmanager
    listKind: AlertmanagerList
    plural: alertmanagers
    singular: alertmanager
  scope: Namespaced
  version: v1
These resource definitions allow our Prometheus Operator to use Kubernetes resources to establish an imperative model for managing Kubernetes resources.
Installing the Prometheus CRD’s
As we will need a cluster admin role binding to install CRD’s across the cluster, we will login to our minishift cluster as follows:
oc login -u system:admin
We’ll create a new namespace in OpenShift for our Prometheus deployment
oc new-project prometheus-dev
We’ll use the Red Hat productized yaml resources to create the CRD’s and our Operator; however, it is worth noting, that these yaml templates do not require use of Red Hat software, and simply install the CoreOS Operator. As result, we will issue the following command to the oc cluster:
oc create -f https://raw.githubusercontent.com/jboss-fuse/application-templates/master/fuse-prometheus-crd.yml
This will install the above custom resources and enable our Prometheus Operator to install Prometheus and other operational capabilities Prometheus requires over its lifecycle. To install the Prometheus Operator we’ll apply another Red Hat Fuse yaml template which will introduce a Service Account for our Prometheus runtime, a Service Account for the Prometheus operator, and everything required to install Prometheus.
oc process -f https://raw.githubusercontent.com/jboss-fuse/application-templates/master/fuse-prometheus-operator.yml | oc create -f -
After a couple of minutes (all depending), we should see a few things installed into the “prometheus-dev” project in our cluster:
[mcostell@work /]$ oc get pods -w
NAME                                  READY     STATUS    RESTARTS   AGE
prometheus-operator-8586c4688-8m2kk   1/1       Running   0          4h
prometheus-prometheus-0               3/3       Running   1          4h
We’ll also see 2 new Service Accounts installed in the “prometheus-dev” namespace:
[mcostell@work /]$ oc get serviceaccounts -n prometheus-dev
NAME                  SECRETS   AGE
builder               2         4h
default               2         4h
deployer              2         4h
prometheus            2         4h
prometheus-operator   2         4h
At this point, we’ll also notice the Prometheus Operator has installed a route for the Prometheus console. Upon issuing this command:
[mcostell@work /]$ oc get routes -n prometheus-dev
NAME         HOST/PORT                                         PATH      SERVICES     PORT      TERMINATION   WILDCARD
prometheus   prometheus-prometheus-dev.192.168.42.118.nip.io             prometheus   <all>                   None
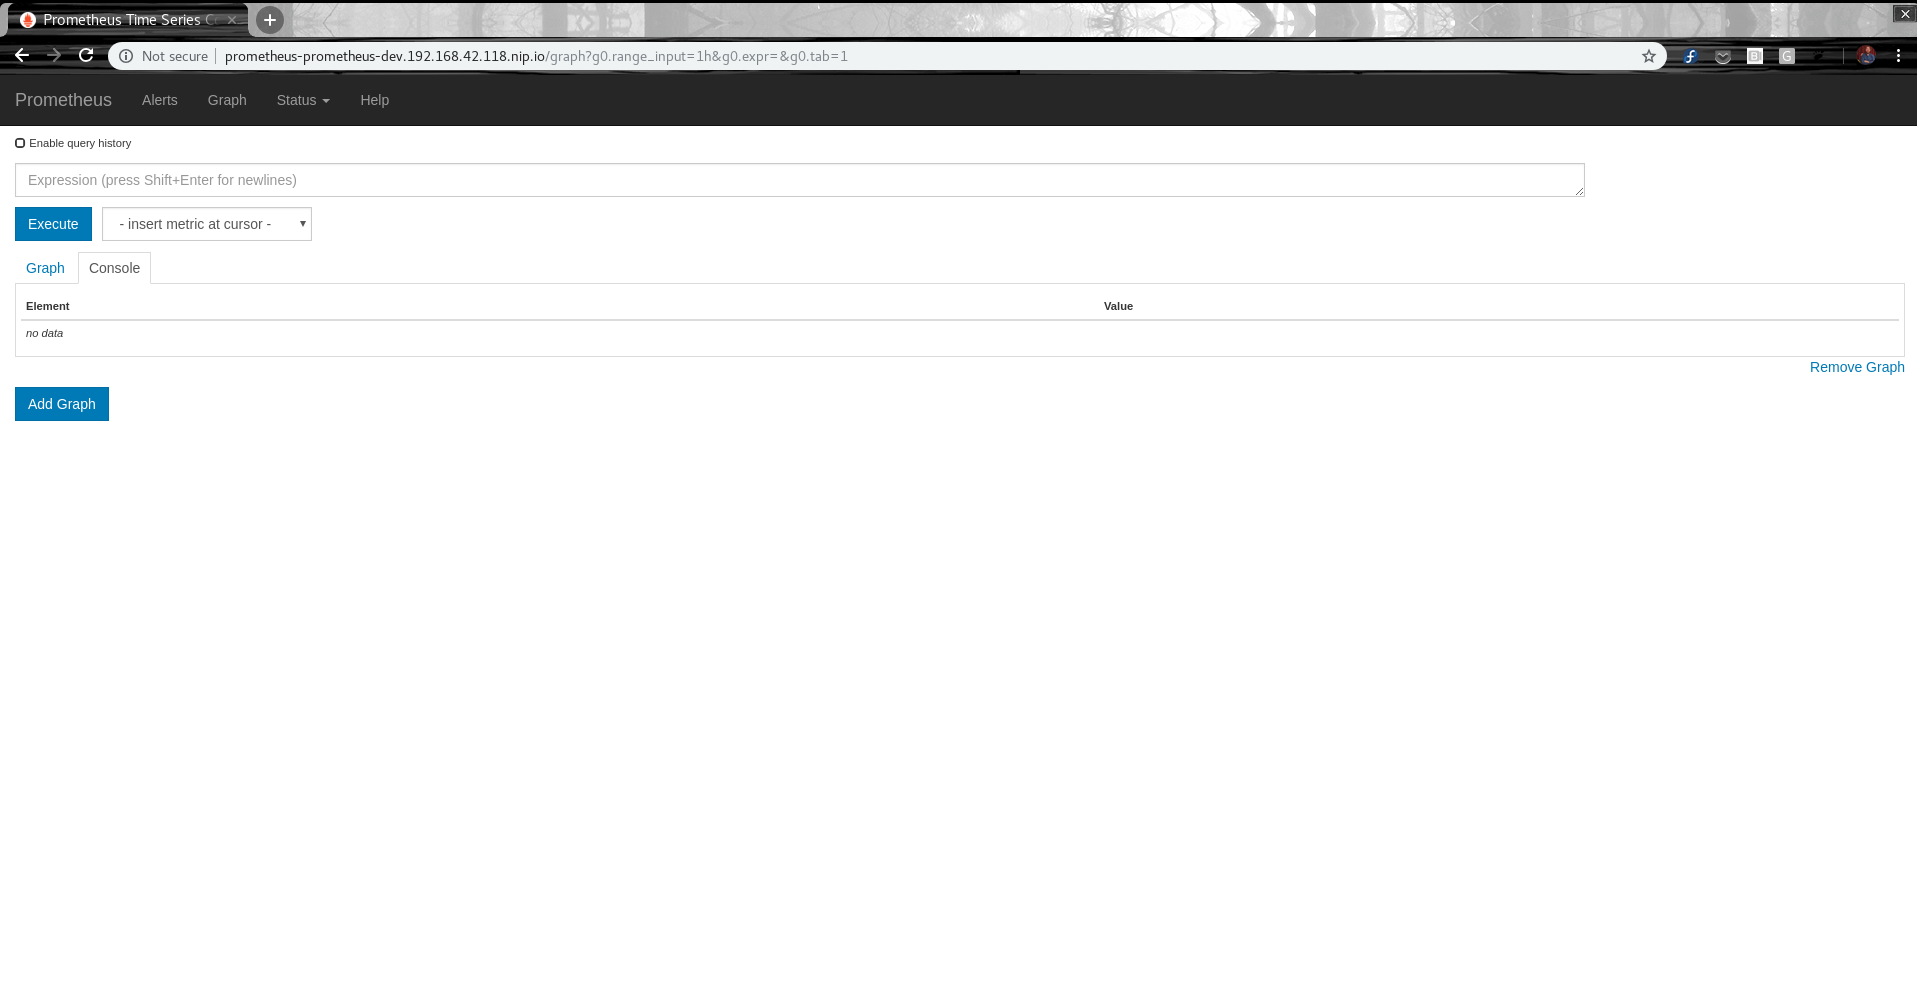
Will deliver the following Prometheus Console that currently does not have anything under management.

Creating a Fuse based Application To Monitor
TODO: Complete This Section
Configuring ServiceMonitors
So at this point, we have a functional Prometheus cluster as launched by the Prometheus Operator; however, we’re not actually monitoring anything. If we recall, we installed a set of CRD’s for the Prometheus Operator’s use, in prior steps. Let’s go ahead and create a Kubernetes resource based on the following CRD we installed into the cluster earlier:
apiVersion: apiextensions.k8s.io/v1beta1
kind: CustomResourceDefinition
metadata:
  name: servicemonitors.monitoring.coreos.com
spec:
  group: monitoring.coreos.com
  names:
    kind: ServiceMonitor
    listKind: ServiceMonitorList
    plural: servicemonitors
    singular: servicemonitor
  scope: Namespaced
  version: v1
As we’re interested in our Fuse application created earlier, we’ll create a Service Monitor resource accordingly using the following productized Red Hat template (again, its worth noting, there is nothing specific to Red Hat in this template, only the CoreOS operator. Templates like these should likely be extended to accomodate the different use cases some of which we’ll discuss below).
The Red Hat template (found at: https://github.com/jboss-fuse/application-templates/blob/master/fuse-servicemonitor.yml) paramaterizes creation of Service and Serivce Monitor Object resources in Openshift/K8s:
apiVersion: template.openshift.io/v1
kind: Template
metadata:
  name: fuse-prometheus-service-monitor
  labels:
    app: fuse-prometheus-service-monitor
  annotations:
    openshift.io/display-name: "Red Hat Fuse service-monitor install"
    openshift.io/provider-display-name: "Red Hat, Inc."
    description: "A ServiceMonitor specifies how groups of services should be monitored - this template defines how to monitor a Fuse application for Prometheus."
    tags: "fuse,prometheus,prometheus-operator,monitoring"
    iconClass: "icon-rh-integration"
    version: "1.0"
message: |-
  prometheus-operator is now deployed to ${NAMESPACE}
parameters:
- name: NAMESPACE
  displayName: Namespace
  value: fuse
  required: true
  description: Namespace in which the prometheus-operator is installed.
- name: FUSE_SERVICE_NAME
  displayName: Fuse Service Name
  value: 'myservicename'
  required: true
  description: The service name of the Fuse application to monitor.
- name: FUSE_SERVICE_TEAM
  displayName: Fuse Service Team
  value: 'fuse'
  required: true
- name: ENDPOINT_PORT
  displayName: Endpoint port
  value: 'web'
  required: true

objects:
#
# OpenShift resources
#
- apiVersion: monitoring.coreos.com/v1
  kind: ServiceMonitor
  metadata:
    name: ${FUSE_SERVICE_NAME}
    namespace: ${NAMESPACE}
    labels:
      team: ${FUSE_SERVICE_TEAM}
  spec:
    selector:
      matchLabels:
        app: ${FUSE_SERVICE_NAME}
    endpoints:
    - port: ${ENDPOINT_PORT}

- apiVersion: v1
  kind: Service
  metadata:
    name: ${FUSE_SERVICE_NAME}
    namespace: ${NAMESPACE}
    labels:
      app: ${FUSE_SERVICE_NAME}
  spec:
    selector:
      app: ${FUSE_SERVICE_NAME}
    ports:
    - name: ${ENDPOINT_PORT}
      port: 9779
As we mentioned earlier when installing our Fuse Rest Application, the Red Hat Fuse image we used to build our Rest service using Springboot and Apache Camel provides us with an underlying prometheus yaml, installs a prometheus jmx srcaper into our runtime, and provides us with a uri for Prometheus to interrogate to collect metrics.
As we setup our Serivce Monitor objects, we’ll notice that our Service Objects that represent our Fuse sample Rest service should expose port 9779 along with other ports needed for K8s to interrogate its health, and whatever port our sample application serves up http traffic for the Rest service it provides. It is also critical that they have the correct labels for our Service Monitor object to select the Service Object and put it under monitoring of Prometheus.
With the above configuration of our Service Monitor objects, we will be pointing our

